“The desire for more, the fear of missing out, the tendency to compare against others, the influence of the crowd and the dream of the sure thing – these factors are near universal. Thus they have a profound impact on most investors and most markets. The result is mistakes, and those mistakes are frequent, widespread and recurring.
Rather than trying to figure out the future, try to figure out where we are in the market cycle, make adjustments if necessary when close to the extremes, and prepare mentally to avoid behavioral mistakes that plague investors throughout. The key is to watch for investor behavior that typically emerges, especially at the extremes of the cycle.”
– Howard Marks, The Most Important Thing
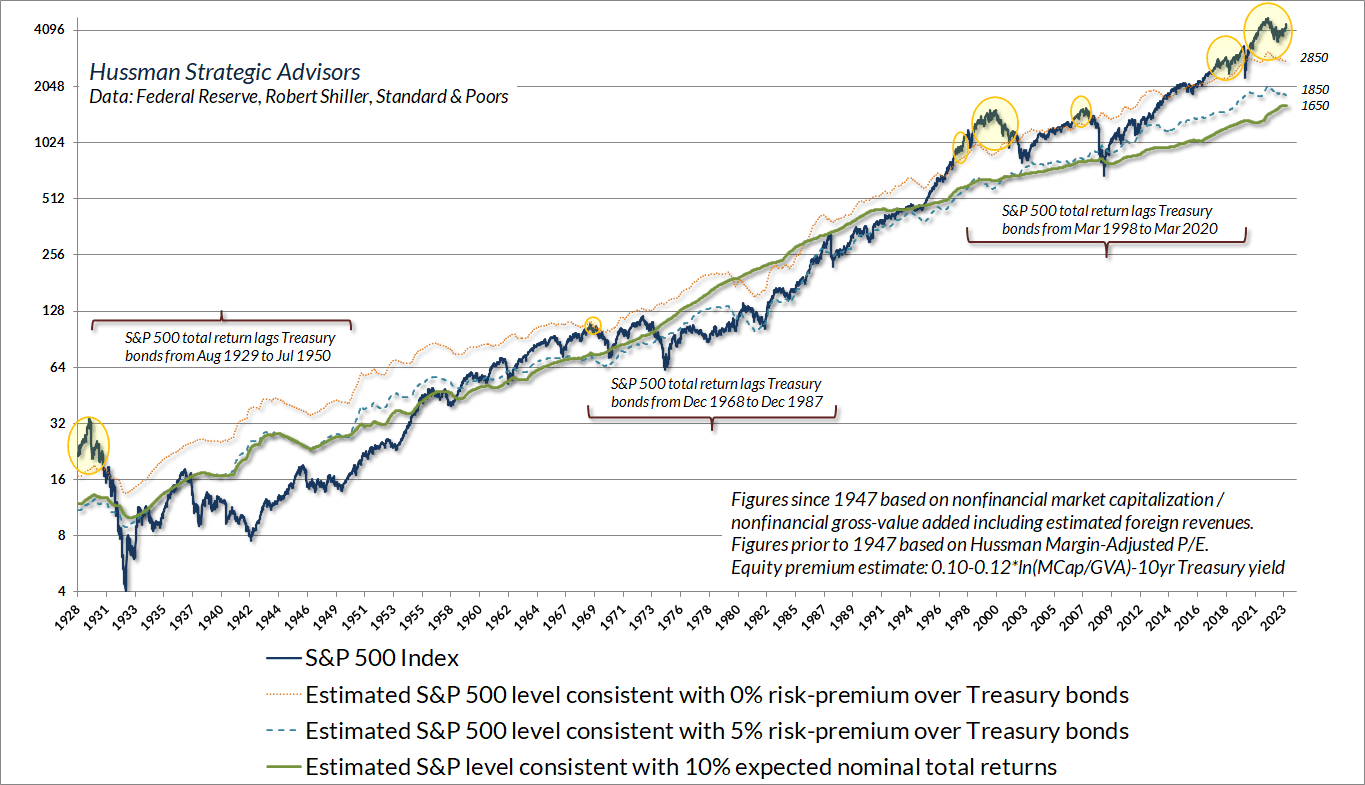
The opening quote from Howard Marks encourages investors to “try to figure out where we are in the market cycle.” The chart below offers a long-term perspective on that question. The solid green line shows the level of the S&P 500 that we associate with average expected nominal returns of 10% annually. At each point in history, the distance between the S&P 500 and that green line mirrors the distance between MarketCap/GVA and its historical norm. The green line presently stands at about 1650 on the S&P 500. For the index to be above that line isn’t to say that the market has to fall, only that expected returns are likely to be less than that 10% historical norm. The depth of the 1929-1932, 2000-2002, and 2007-2009 market collapses suddenly make more sense, don’t they?
The dashed blue line shows the level of the S&P 500 that we would associate with a historically run-of-the-mill 5% “risk premium” over-and-and above Treasury bond yields. That line stands at about 1850 here. Finally, the dotted orange line shows the level of the S&P 500 that we would associate with zero return over and above Treasury bond yields. That line stands at about 2850 here, correctly suggesting that we expect the S&P 500 to sharply lag the return on Treasury bonds over the coming years. Of course, that’s happened before. The yellow bubbles show previous instances when S&P 500 valuations implied total returns below Treasury bond returns. I’ve included several brackets, showing that from 1929-1950, 1968-1987, and 1998-2020, that’s exactly what happened. I don’t expect the current instance to be different.

John Hussman, Grasping the Suds of Yesterday’s Bubble, https://www.hussmanfunds.com/comment/mc230619/